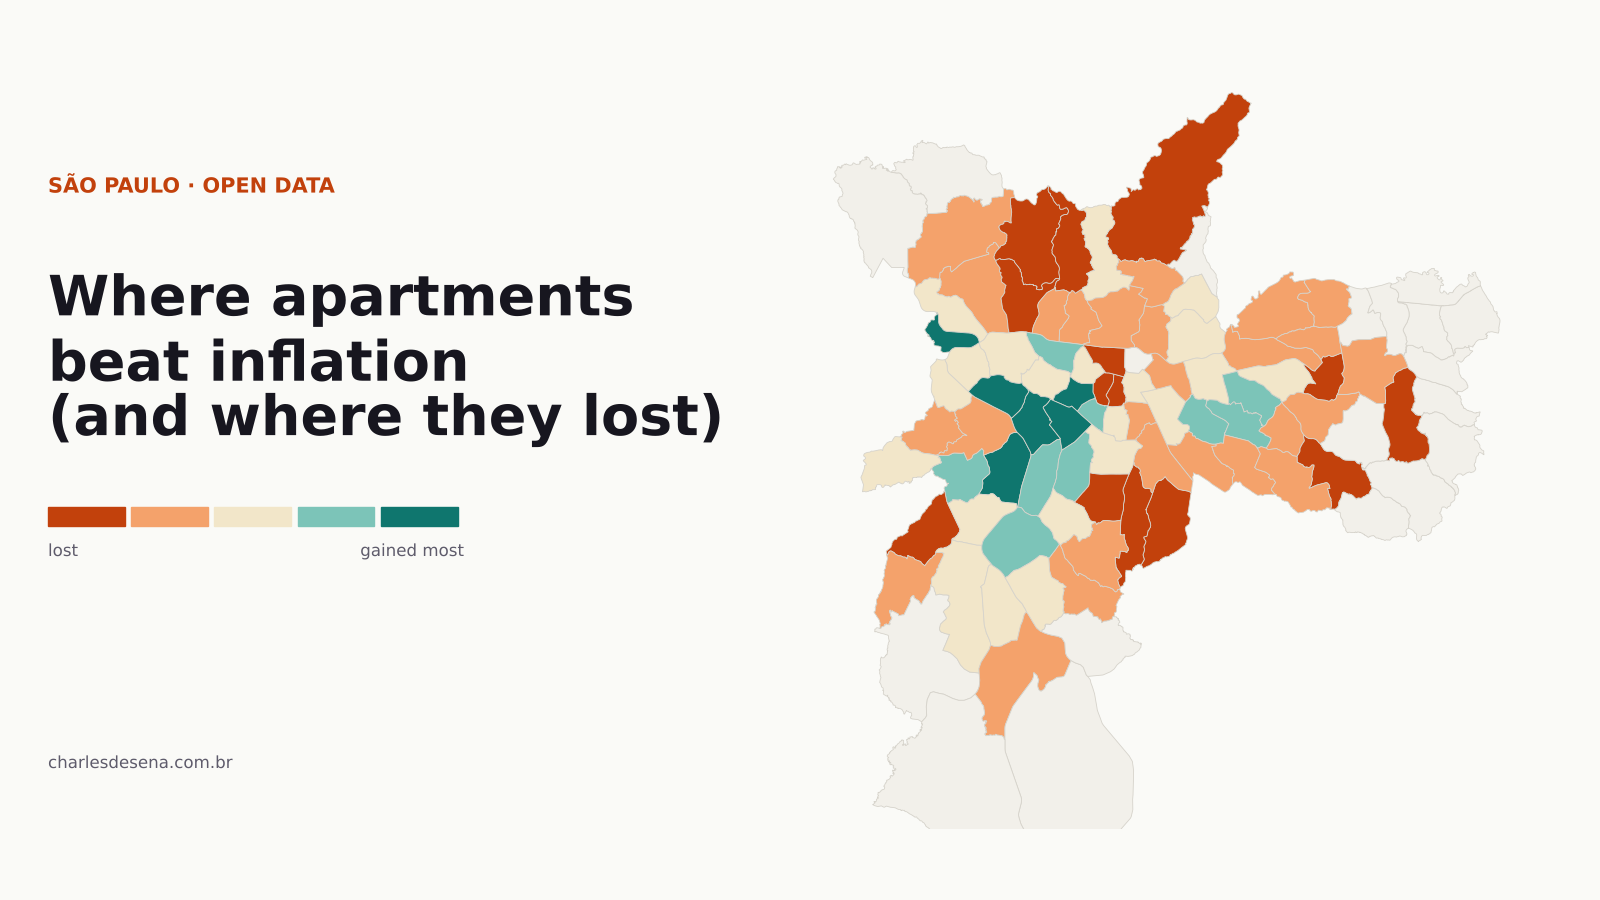
“Property always goes up.” Everyone has heard it. São Paulo’s city government has the data to test it: every property purchase in the city pays ITBI, the municipal transfer tax, and the Finance Department publishes every paid record, with the price declared in the deed, the floor area and the property’s tax ID.
I put together 1.35 million tax records paid between January 2019 and September 2026. Because the tax ID identifies each apartment, you can see something almost no price index shows: what the same unit was worth when it was bought, and what it was worth when it was sold again.
The map: pick what you want to see
Choose between price per m², gains above inflation or new units, and hover over each district to see the numbers.
What the data shows
1. The same apartment barely beat inflation. I analyzed 36,000 resales: apartments sold twice in the period, at least 1 year apart. Between 2019 and 2026, their price rose 50% to 61% in reais, depending on how strict the filter is. Brazilian inflation (IPCA) over the same period was 45%. The real gain is between 3% and 11% over seven years, not per year.
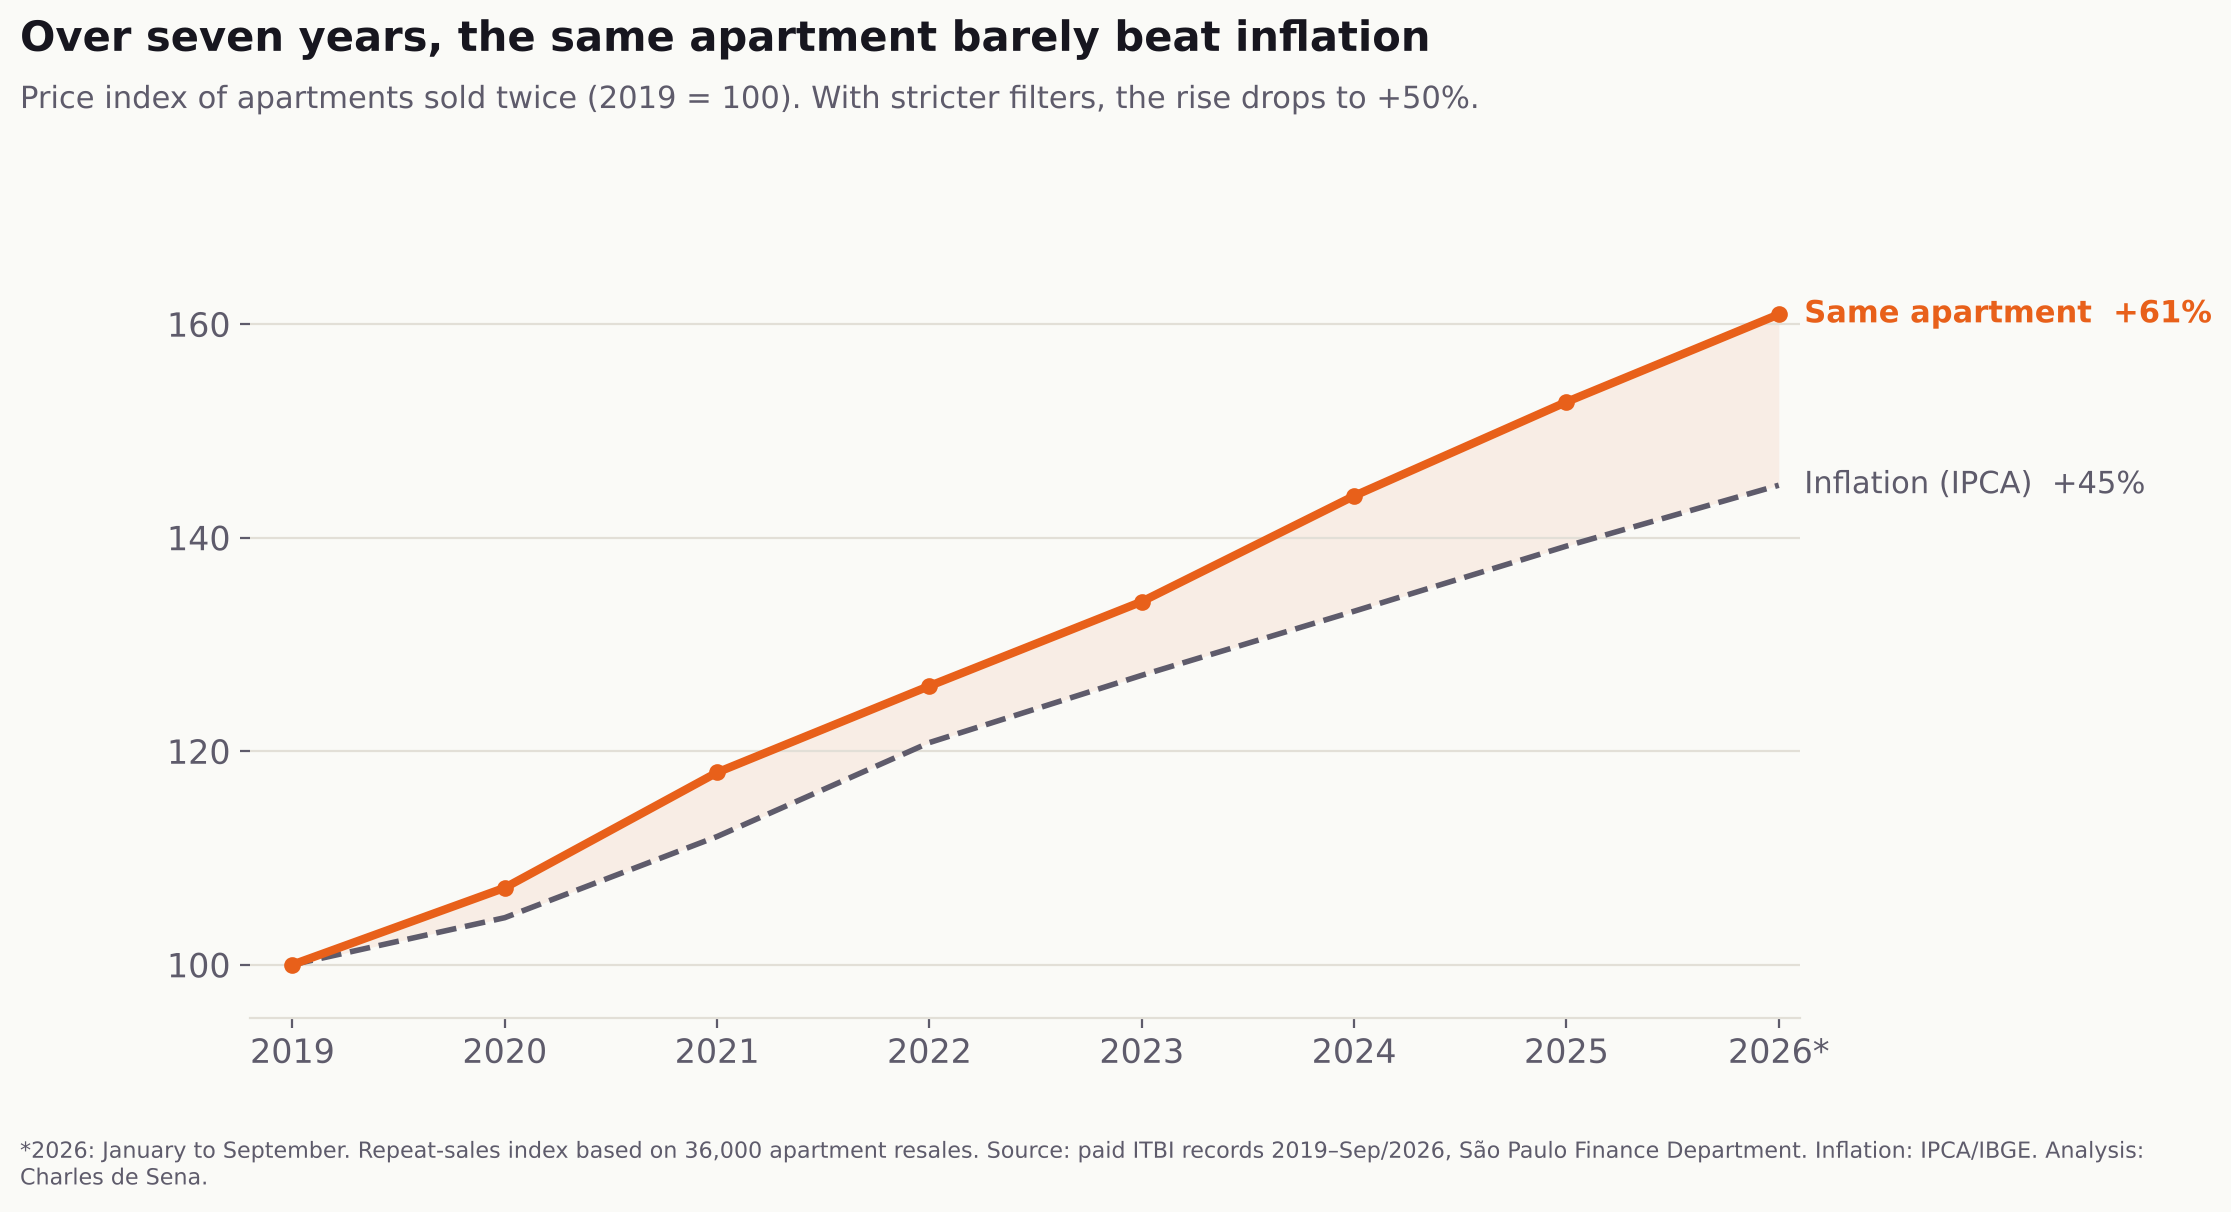
2. Half lost to inflation. Among resales where the owner kept the apartment for 3 years or more, the median gain above inflation was 0.1% a year, and 49% sold for less than they paid, adjusted for inflation. Adding the quicker resales brings the share down to 42%, but those include more renovations and below-market purchases bought to resell, which lift the average. And this still doesn’t subtract notary fees, transfer tax, broker commissions or condo fees.
3. Expensive districts gained the most. Splitting the districts into three groups by their 2019 price, the most expensive gained 1.6% a year above inflation, the middle group 1.1% and the cheapest 0.4%. The leader is Jardim Paulista (+5.7% a year), followed by Morumbi, Pinheiros, Consolação and Alto de Pinheiros. At the other end are Sé (−3.3% a year), República (−1.4%) and Cachoeirinha (−1.3%). The old downtown lost the most.
4. Price per m² varies more than fourfold within the city. The median resale apartment in São Paulo sold for R$ 5,189 per m² in 2025–26. In Jardim Paulista, R$ 8,654; in Itaim Bibi, R$ 8,475; in Moema, R$ 8,426. In Cidade Tiradentes, R$ 2,081. These figures use the area in the property-tax register, which includes a share of the common areas, so they are lower than listing prices on property portals (see the limitations below).
5. Sales of new units took off. Units sold before getting their own title, mostly new launches and recently delivered buildings, went from 5,000 in 2019 to 83,000 in 2025. In 2026, through September, there are already 69,000. They are now 4 in every 10 recorded purchases in the city. Their median price went from R$ 220,000 to R$ 330,000, and the share financed through Minha Casa Minha Vida, the federal housing program, rose from 16% to 37%.
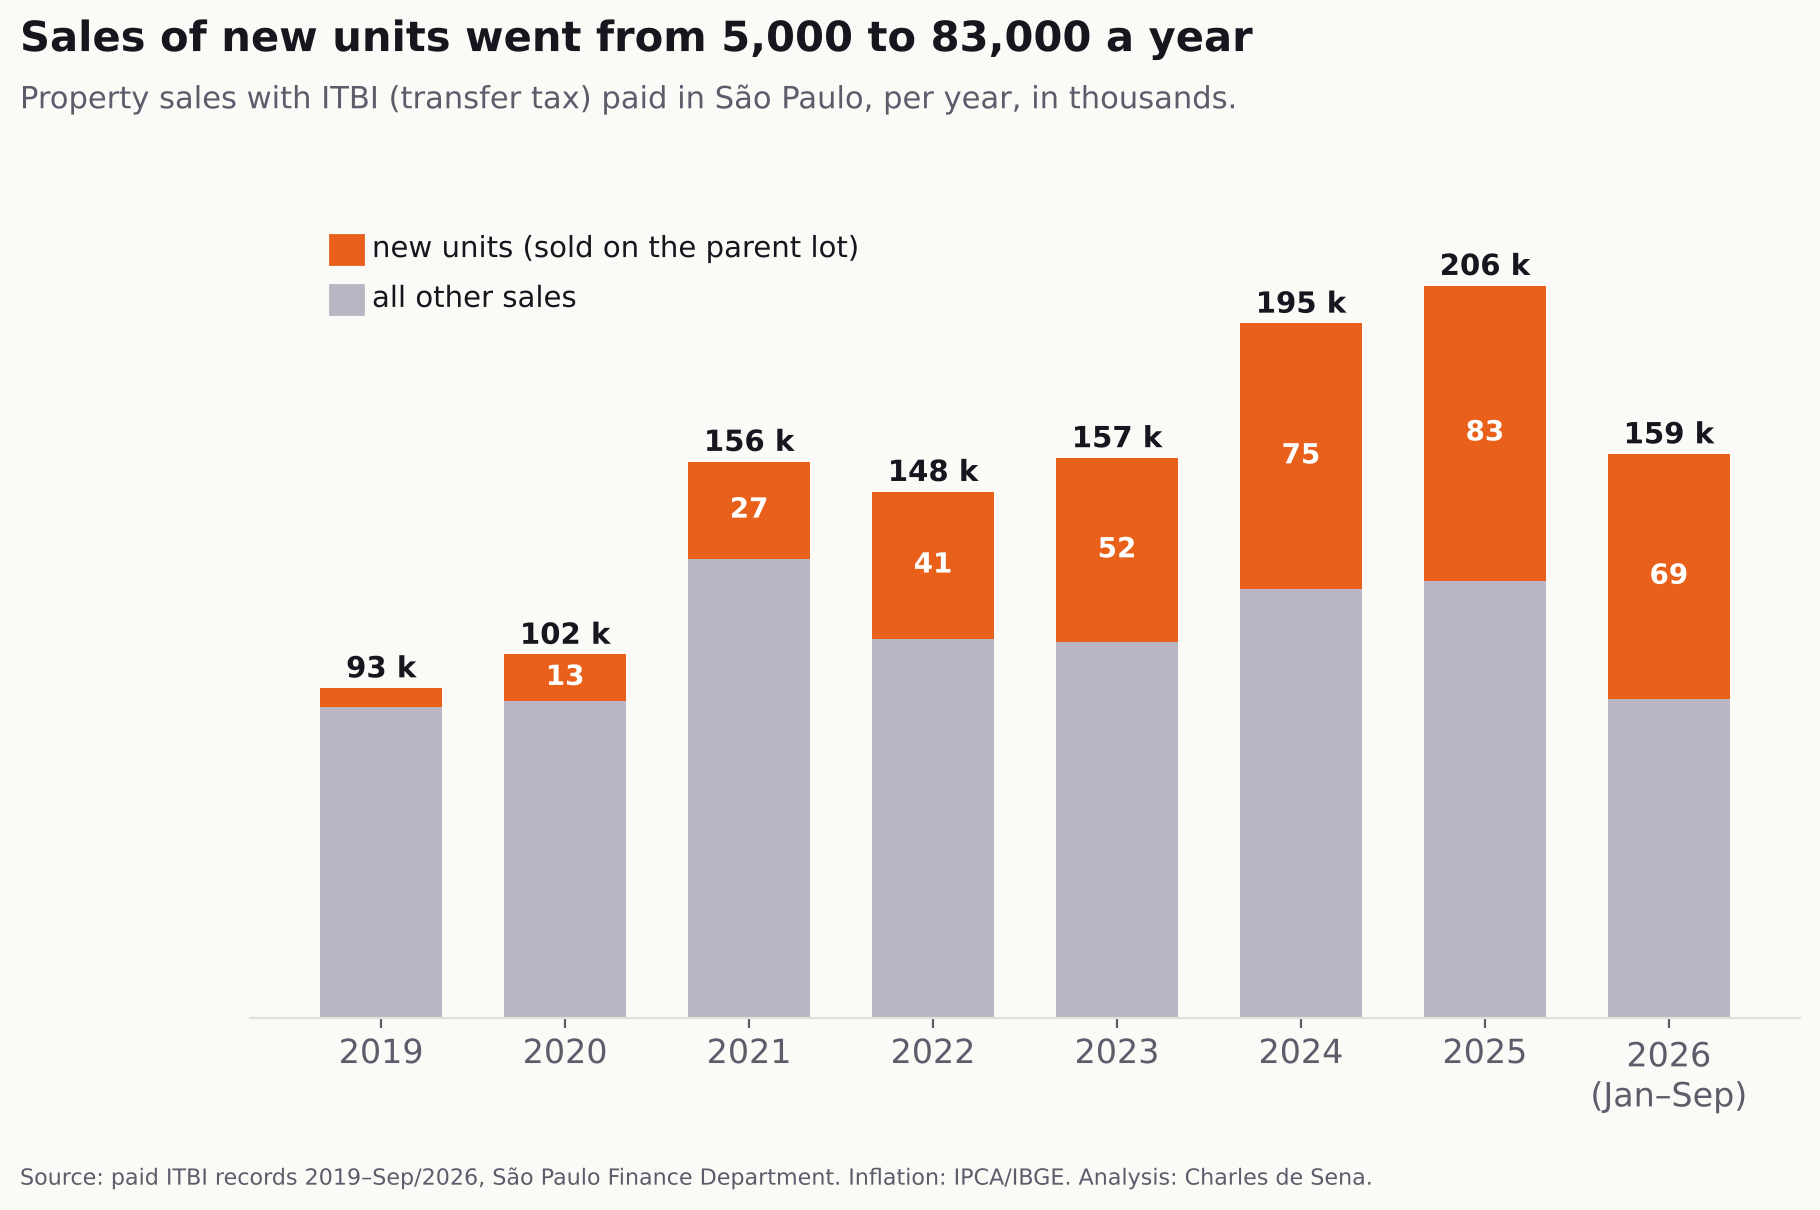
6. Where the new units are. From 2024 to September 2026, the districts with the most new units sold were Santo Amaro (13,700), Lapa (9,200), Barra Funda (8,700), Itaim Bibi (7,400) and Ipiranga (7,100). In Lapa and Barra Funda, about half went through Minha Casa Minha Vida; in Itaim, only 3%.
7. More new supply neither held prices down nor pushed them up. I tested whether districts with more new units, relative to the size of the local market, gained more or less. I found no relationship (correlation of −0.01). What best explains the gains is how expensive the district already was.
What to do with this
- Property is not an automatic hedge against inflation. In much of the city, people who bought in 2019 and sold now broke even or lost in real terms, even before transaction costs.
- Location matters more than timing. The gap between districts (from −3% to +6% a year) is far bigger than the gap between buying in one year or another.
- Be skeptical of the “it always goes up” sales pitch. With 83,000 new units a year, many of them studios at similar prices, resales will compete with a lot of identical supply.
- For developers and brokers: the same data lets you measure real closing prices, sales speed and competition block by block, instead of relying on asking prices.
Limitations
- Declared price. ITBI uses the price stated in the deed. There may be under-reporting, but it shouldn’t change much from year to year, and comparing the same unit reduces the effect.
- Tax-register area. The built area in the register includes a share of the building’s common areas. That’s why the R$/m² is lower than what portals like FipeZap show, since they use private area. It works for comparing districts and years with each other, not for comparing with listings.
- Renovation and aging. Comparing the same unit can’t tell whether it was renovated (which pushes gains up), and it doesn’t account for the building getting older (which pushes them down).
- New units. I classified as a “new unit” any purchase recorded on the parent lot with less than 1% of it transferred. It’s an approximation: not every off-plan unit shows up this way, and some sales of land fractions may be included.
- Date. I use the month the tax was paid, which can be months after the deal closed.
- Districts with little data. The gains map only colors districts with at least 60 resales; the lists use those with 150 or more. With resales 2 or more years apart, the numbers drop, but the order of the districts barely changes (correlation of 0.93).
Methodology
- Source: “Dados das Transações Imobiliárias com recolhimento de ITBI”, São Paulo Municipal Finance Department, January 2019 to September 2026 (1,352,376 records). The files exclude rural properties and taxes paid through the installment program (PPI).
- Location: the first six digits of the tax ID (SQL) give the fiscal sector and block. I linked each block to its district with a table derived from GeoSampa and checked it against the official district boundaries: 99.9% of blocks match.
- Price sample: sales of whole apartments (100% transferred), active register, 20 to 600 m², from R$ 50,000, excluding the cheapest and most expensive 1% per m² each year: 421,699 sales.
- Same unit: apartments sold twice at least 1 year apart (36,425 pairs). The city index is a repeat-sales regression by year; the district gain is the median real annual change of each pair, with a bootstrap interval.
- Inflation: annual IPCA/IBGE from 2019 to 2025 and year-to-date through September 2026 (3.95%). Values in September 2026 reais.
Media outlets may reproduce the charts and map with credit: Analysis: Charles de Sena using open data from the City of São Paulo.
Do you develop, sell or invest in real estate and want this analysis for a specific area or product? See the Real Estate Intelligence service or message me on WhatsApp.