In Medellín, almost everyone has an opinion about gentrification. Provenza, Laureles, Comuna 13 and the city center show up in op-eds, city council debates and taxi conversations. What almost never shows up is a more useful question: can you see it coming?
The background numbers are well known. According to Tourism Office data cited in a National University of Colombia study, the city went from 4,219 tourist housing units in 2021 to 36,417 in 2025. But by the time a neighborhood makes the news for rising rents, the transformation has already happened. For a public policy, a developer or a community organization to act, the warning has to come earlier.
So I built an early-warning system with what anyone can download: the City of Medellín’s open data. And most importantly, I tested it against the past before using it to talk about the future.
What the index looks at
The index combines four signals per neighborhood (barrio). None of them means “gentrification” on its own, but together they describe the moment a barrio starts changing hands:
- New tall buildings. Structures of 5 or more floors appearing in the cadastre, per 100 existing ones. It’s the footprint of redevelopment: one- or two-story houses turning into apartment buildings.
- Built area. How much the barrio’s built floor area grows above the city average.
- Commercial mix. How many cafés, bars, restaurants, gyms, lodgings and real estate firms open for every corner store, hardware shop or repair workshop that opens, according to the city’s business registry.
- Land-value gap. How much pricier the land in neighboring barrios is. A cheap barrio surrounded by expensive ones has room for prices to “catch up”.
Each signal becomes a percentile, and the index is the plain average of the four. There are no hand-tuned weights and no black box: anyone can see why a barrio scores high.
The test: would it have worked in 2020?
An untested index is just an opinion with charts. So I computed the signals using only data up to 2020 and compared them with what actually happened between 2021 and 2025: cadastral revaluation above the general annual adjustment, built-area growth, new tall buildings and the arrival of amenity businesses.
Of the 25 barrios the index flagged in 2020, 16 ended up among the 20% most transformed in the city. Random picks would have hit 1 in 5.
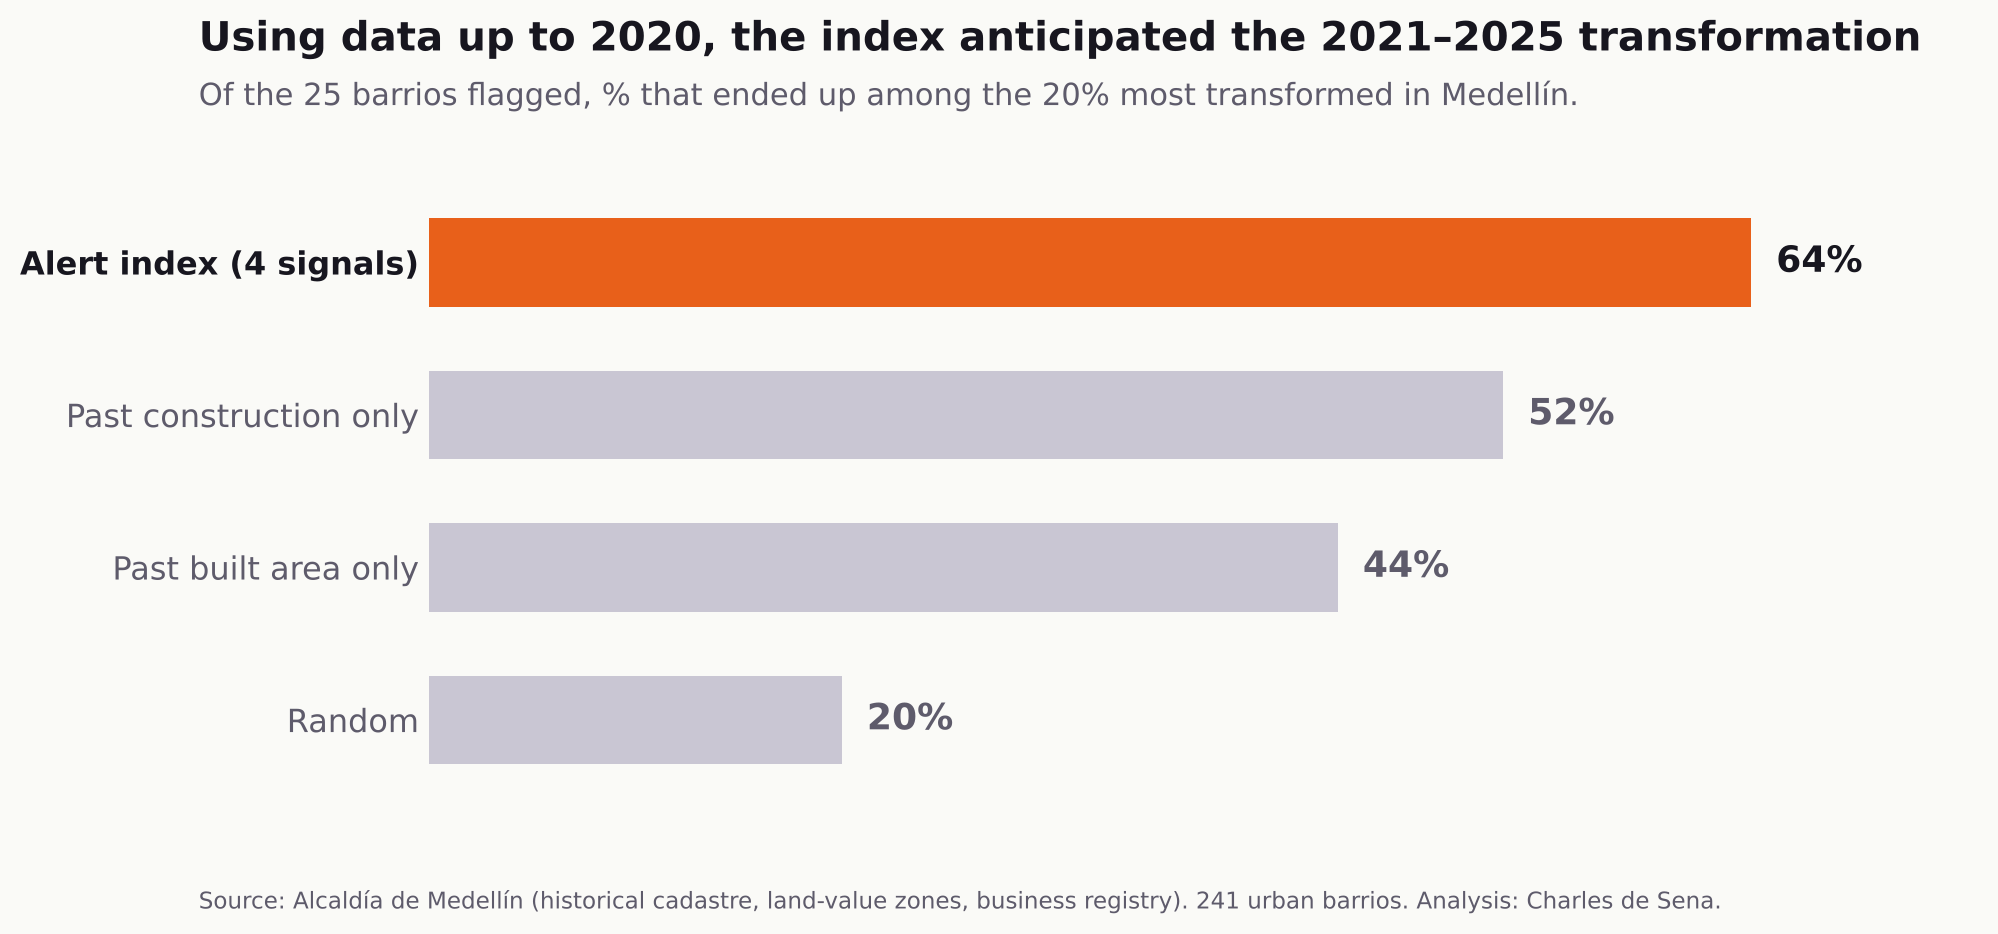
The comparison that matters isn’t against chance but against the obvious guess: assume that whatever was already growing keeps growing. Using past construction alone gets 52% right. The index reaches 64% because it adds two things construction doesn’t capture: the kind of business moving in and the price gap with neighboring areas. The rank correlation between the index and actual transformation was 0.39 (90% confidence interval: 0.29 to 0.48) across 241 urban barrios.
I also tested, and dropped, a signal that seemed obvious: commercial-opening “momentum”, meaning a barrio gaining share of the city’s new businesses. In an earlier, independent window (2009–2017) it predicted nothing and tended to revert: barrios that suddenly opened many businesses usually went back to normal. Removing it improved the index in both windows.
What the index flags today
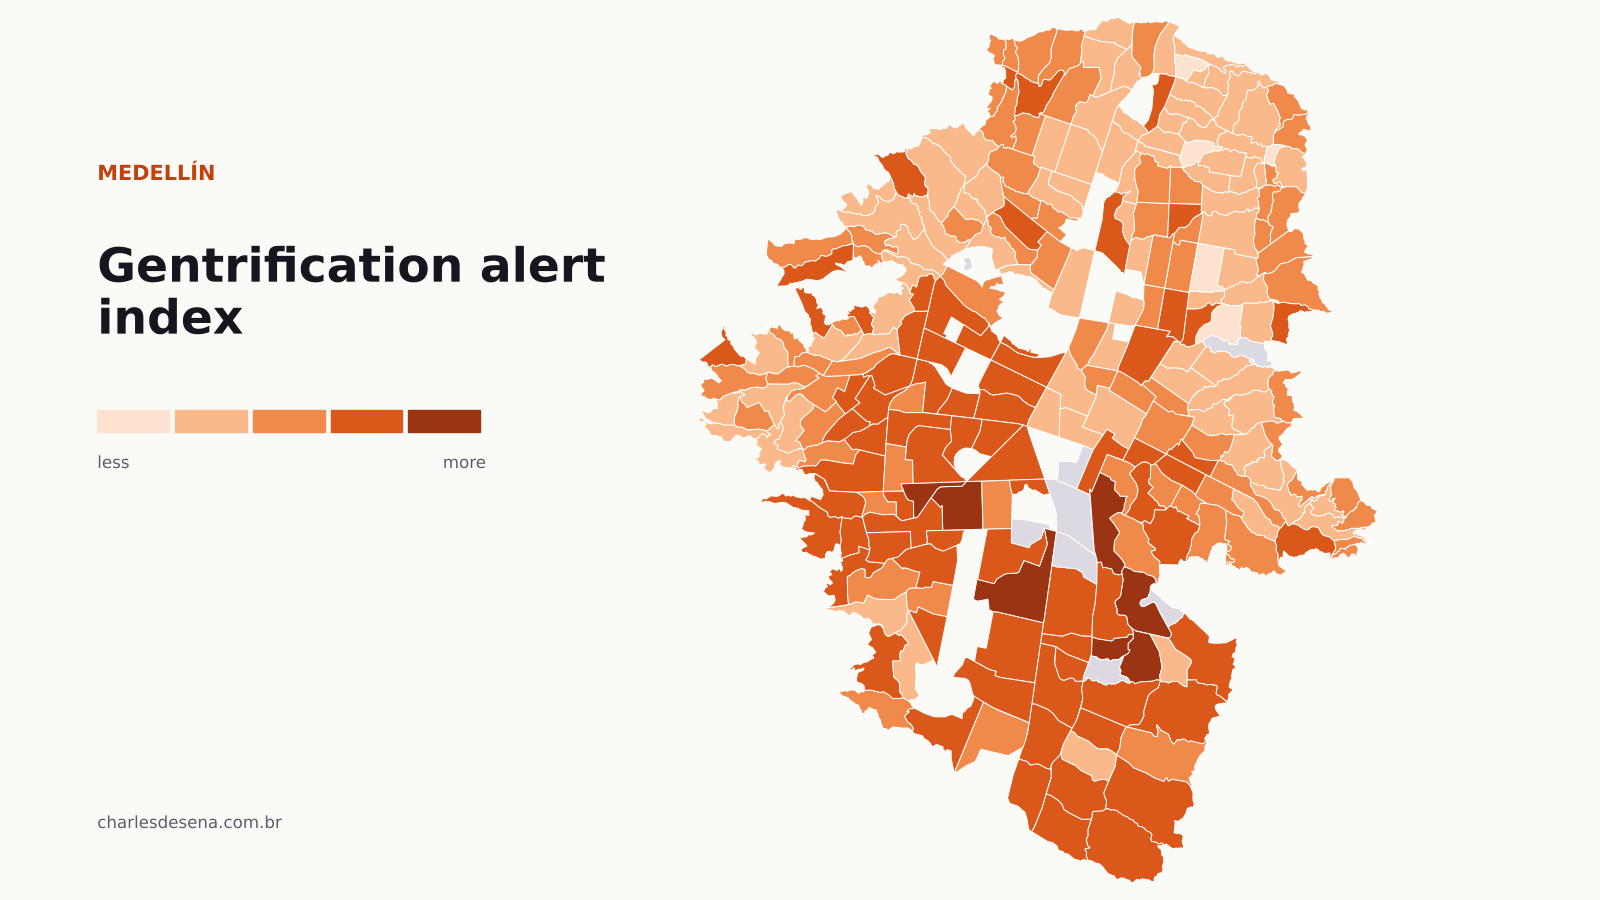
This is the index recalculated with the latest data: construction through 2025, 2025 land values and business openings through 2024. Hover over a barrio to see its signals, and use the checkbox to show only working-class barrios. The “Test 2020 → 2025” tab shows the earlier exercise on the map.
Across the whole city, the highest scores are in middle- and upper-income barrios such as Asomadera No. 2, Santa Fé, Lalinde, San Diego and Rosales. There, it’s more accurate to talk about appreciation than gentrification: there is no low-income population to displace.
The warning that matters is in working-class barrios (mean estrato of 3 or less). In Colombia, estrato ranks housing from 1 to 6 by socioeconomic conditions. The ones that stand out most are:
- Buenos Aires, along the Ayacucho tramway, with many new tall buildings and rising amenity businesses.
- Eduardo Santos (San Javier) and Altamira (Robledo), with the fastest pace of buildings of 5 or more floors.
- Las Violetas and El Rincón (Belén), where the main signal is the price gap with neighboring barrios.
- Manrique Central, with a clear shift in the kind of business opening.
- Trinidad (Guayabal) and Moravia (Aranjuez), two areas where urban redevelopment is already under way.
A high score is not a verdict. It means the barrio shows today the same pattern that, in the past, came before a strong transformation. It’s a flag to look closer, with site visits, conversations and rent data, before the transformation is a done deal.
What it still can’t see
This is a first version built only on free, open data, and it has clear limits:
- It’s weaker exactly where it matters most. In working-class barrios, the correlation with actual transformation drops to 0.23. Change there starts with things the cadastre doesn’t record: rents, Airbnb, houses bought to renovate.
- Cadastral value is administrative. In 2021 the city used much larger value zones than in 2025, so I didn’t use it alone as the outcome measure.
- No Airbnb or rent data yet. That’s the next layer. Short-term rental data exists, but it’s paid. With it, the warning could come much earlier in working-class barrios.
- A single full test. Zone-level land values have only been published since 2021, so the full test covers one window. Repeating it every year will show whether the index keeps working.
Why it matters
Medellín has one of the best open-data infrastructures in Colombia: a year-by-year historical cadastre since 2005, land values by zone and a registry of every business. With that data, the conversation can move from competing opinions to a system that warns years in advance and can be audited.
For the city government, that means planning tenant protection, social housing or short-term rental rules where they can still make a difference. For developers and real estate firms, it means understanding where the city is heading based on evidence rather than instinct. And for neighborhood organizations, it means having their own data to negotiate on equal footing.
Methodology
- Unit: 241 urban barrios (comunas 1 to 16) with more than 500 residents and complete data.
- Construction: yearly building layers from the City of Medellín’s historical cadastre (GeoMedellín), 2012–2025. Built area = footprint × number of floors. Growth is measured against the city’s, to cancel out administrative changes that affect every barrio equally.
- Land value: land-value zones (zonas geoeconómicas) 2021–2025, value per m², sampled on a 60 m grid and summarized as each barrio’s median. Revaluation is measured above each year’s general adjustment (3%, 4.2%, 7.9% and 3%).
- Businesses: the city’s business registry (RIT), by opening date and location. Amenities: ISIC codes for restaurants, cafés, bars, gyms, beauty salons, lodging and real estate. Neighborhood shops: corner stores, mini-markets, hardware stores, workshops and repairs. A pseudocount of 5 keeps barrios with few openings from looking like a boom.
- Actual transformation (2021–2025): average of the percentiles of cadastral revaluation, built-area growth, new buildings of 5+ floors and share of amenity openings.
- Estrato and population: mean estrato by city block and the city’s population projections by barrio.
- Tourist housing source: Santana and Aristizábal (2025), Bitácora Urbano Territorial, National University of Colombia, with data from Medellín’s Tourism Office.
The charts and the map may be reproduced by media outlets with credit: Analysis: Charles de Sena using open data from the City of Medellín.
Do you work for a developer, a real estate firm or a public agency and want this kind of analysis for your area? See the Real Estate Intelligence service or message me on WhatsApp.